ODE Map Search Tab
The ODE Map Search provides the user with a mechanism for visualizing the location of data products on the surface of Mars, Venus, Mercury, and Earth's moon.
ODE Map Search Pages
Example:
ODE Search and Download Tutorial (pdf)
Using the new ODE Map Interface Tutorial (pdf)
The Web Mapping Application page has three main parts:
-
At the top right, a toolbox allows the selection of areas of interest via point, rectangle, or free form polygon.
-
Map - the map's display defaults to a cylindrical center point 0 longitude view. North polar and south polar views are also available.
-
Map Display Controls, on the left side of the page, allows interaction with the map by selecting map layers to display, map filtering options, and viewing area selection search results.
-
Select Layers - Map product layers (feature layers) and basemaps can be toggled on and off. The transparency of the layers can be adjusted. Additionally, the functionality exists to display full coverage of a product's layer or limit it to your selection area.
-
Set Filters (Optional) - This tab allows the user to filter the map layer contents based on Product ID, landing site, date/time filters, and observation angles. The map can be zoomed to a specific target feature, as well.
-
View Selection Results - The results of an area selection are displayed in a summary and detail list on this tab. The selected products can be added to the download cart from this location.
-
Example:

Map Toolbar Reference Guilde
| Name | Icon | Description |
|---|---|---|
|
Zoom In |
|
Click the zoom button to zoom in levels on the map interface. User can also hold down the shift key while drawing a rectangle, as long as the Pan option has been selected or no selection button has been pressed. |
|
Zoom Out |
|
Click the zoom out button to zoom out on the map. |
|
Pan |
|
Click and drag the map. |
|
Full Extent |
|
Full extent: Immediately zooms the map out to the area of all features and layers. The active tool does not change. |
|
Help |
|
Click Button: Click this button to display the search page's map help overview page (this page). |
|
Select Point |
|
Click a spot: Choose this button to select a point of interest and retrieve the features from selected layers that intersect the point. The results will be displayed in the View Selection Results Tab of the map interface. |
|
Select Rectangle |
|
Click and drag a rectangle: Click and hold the left mouse button down on the map at one corner of the rectangle to highlight on the map. Drag the mouse to the other corner of the rectangle, and release the mouse button. The map search interface will query your selected (and possibly filtered) map layers for products with footprints intersecting your selected area. The results will be displayed in the View Selection Results Tab of the map interface. |
|
Select Polygon |
|
Click and drag a desired shape: Click and hold the left mouse button down on the map at the starting location. A counter clockwise motion to draw the desired shape is recommended. Release the mouse button, and the polygon will be automatically closed from that location to the starting point. The map search interface will query your selected (and possibly filtered) map layers for products with footprints intersecting your selected area. The results will be displayed in the View Selection Results Tab of the map interface. |
|
Remove Selection |
|
Click Button: Click this button to remove your selection area. This will also reset the View Selection Results tab contents because no area selection will exist after pressing the button. |


Working with the Map Display Controls
The Select Layers Tab contains a list of all the product layers (mission/instrument/product type groupings) that are available for display, filtering, and product selection.
Example:

Sections Expanded:
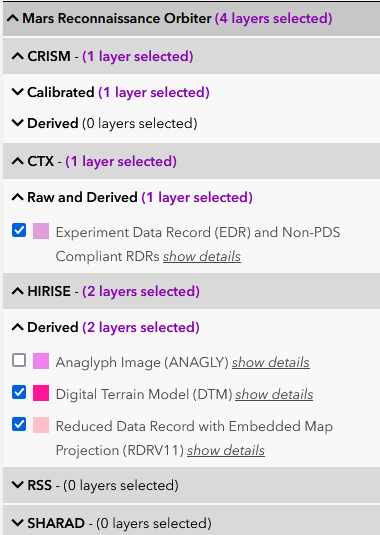
Select the checkboxes of the layers you wish to display on the map. You can view more detail about the layer by clicking the show details link beside each layer name. This will expand a section where you can view more information about the layer. You will also see a link to more details about the layer. Additionally, you can adjust the layer transparency by dragging an adjustment control left or right.
Example:

Coverage Display Options
Example:

This option is useful after the Select Products By Area button on the map tool bar has been used to select an area on the map to query. The option can be used to limit the map layer to only display products that intersect the selected area. After this option has been enabled, new selection areas can be created to display only the products of those locations, as well.
Here is an example of the default setting to "Display All Products' Coverage":

Here are the results when the option is set to "Display Only Products Selected By Area":

If you choose the "Display Only Products Selected By Area" and select a large area, a map product limit will be reached at ,1000 products per layer. A warning will be displayed that provides two suggestions. You can either select a smaller area with the "Select Products By Area" option. The alternative is change the map display back to the default of "Display All Products' Coverage".
Example:

Selecting Products by Area
One of the primary roles of the Map Interface is to allow the user to review data product coverage and select products based on their coverage area for download.
There are multiple steps to achieve this, which will be described below.
Example:

-
Select the layers you are interested in viewing on the Select Layers tab.
-
Apply any desired filters on the layers in the Set Filters tab.
-
Using the Zoom In button, zoom to the area you which to study.
-
Press the Select Products By Area button on the map toolbar. Then proceed to draw a selection area on the map.
-
The map services will be queried. If you are not viewing the View Selection Results tab, a yellow box will be displayed that indicates search results were found. This can be clicked to view the View Selection Results tab, or you can click the tab manually.
-
The View Selection Results tab provides a summary of products found within the selected area. It also provides a full detail list of the products found in the selected area for the enabled layers. At this point there are several options.
-
By clicking the Output Results button, the listed products can be output in as text file list containing the PDS product's basic information and direct links to the product's detail page in ODE and the product's files.
-
The View in Table button will navigate the user with the listed products to the traditional search results list found in ODE. The product detail pages can be displayed on the right side of that page.
-
The Add All Results to Cart button will add all of the results to the cart, whether they are listed on the first page listing of the results or not. Remember, the download cart is limited to 25GB per download request.
-
The Update Cart button will add listed products that are selected by check box to the download cart. Products that are not selected will be removed from the cart if they are already in the download cart.
-
Features - Select Area or Zoom To
The Features - Select Area or Zoom To section contains allows the user to zoom the map to named features of Mars, Mercury, Venus, and Earth's moon. The functionality also allows the user to select the location at the same time, which is the equivalent of selecting an the area with the Select Products By Area button.
The Feature Type drop down box contains a list of features types.

This list filters the results of Feature Name drop down box. The Feature Name drop down box contains a list of all of the features of the type selected from the previous box.

There are several options after selecting the desired feature name.
The Select Area & Zoom To Feature button will zoom to the location of the selected feature and select the area the same as if it was selected with the Select Products By Area button. See example:

The Select Area button will select the location of the feature the same as if it was selected with the Select Products By Area button, but the map will not zoom to the location. See example:

The Zoom To Feature button will zoom to the location of the feature, but it will not select the area. See example:

The Reset button will zoom to map to the full extent and deselect any selected area. This will also removed any products listed in the "View Selection Results" tab. See example:

Set Map Layer Filtering Criteria
Product ID Filter
Each PDS data product has a unique Product ID. Individual data products can be found with an exact match or multiple products can be found using the wild card parameter.
Set desired criteria to filter the product foot prints that are displayed on the map. An exact ProductID may be used to find a specific product's footprint on the map. Also, the wildcard character * may be used before, after, or in the middle of a partial Product ID to find products matching your desired pattern.
The filter must be applied below to affect the map presentation.
Examples:
Exact Product ID

Partial Product ID with ending wildcard character

Leading wildcard character ending with partial Product ID

Partial Product ID with ending wildcard character in the middle

Date/Time Filter
You may also filter your query by observation time or product creation time. An observation time query filters products by observation UTC Start and Stop time range. It will find products with an observation time within the specified range, and products with an observation range covering your query parameters. The product creation time query finds products that were created by instrument teams within the specified UTC time range.
You may filter by either a single value or a value range. If you enter just a single value in the first field, ODE will select products that start with the entered value. For example, if you enter "2007-11", ODE will return only products with an observation time that covers or falls in 2007-11-xxTxx:xx:xx. If you enter "2007-11-01T00.13.27", ODE will return only products with an observation period during that point in time. You may also enter a range by entering values in both fields. ODE will select products within that range, products that cover the range, and products that overlap the range.
Applying Filters
When working with the Map Layer Filtering Criteria, there are three controls to manage the filter implementation.
The Apply Filter button will apply any filters you have set to the displayed map layers. You should see the map display change after this button is pushed. It will also update the "Search Criteria Status" to "Filter Applied", to indicate the current filtering status.

The Remove Filter button will remove any filters you have set to the displayed map layers, but it will keep the values you have entered in the filtering text boxes. By not removing the values from the filtering text boxes, you can apply and removes filters quickly while working with the map interface. It will also update the "Search Criteria Status" to "Filter Not Applied", to indicate the current filtering status.

The Clear Fields button will remove any filters you have set to the displayed map layers. You should see the map display change after this button is pushed. Additionally, the button will remove the values you have entered in the filtering text boxes. It will also update the "Search Criteria Status" to "Filter Not Applied", to indicate the current filtering status.

Map Interface Troubleshooting
The Map Interface in compatible with the following browsers: Internet Explorer, FireFox, Google Chrome, and Safari.
Cookies and JavaScript must be enabled for the Map Search Interface to function.
The Map Search Interface contains many different components interacting and pulling data from our map servers at the same time.
The following situations could cause problems while loading the maps within the interface:
-
A slow Internet connection
-
A wireless network that is experiencing connection problems or has some type of throttling enabled
-
A slow user machine - map interface interaction can be computationally intensive on the client side
If you experience problems, the first recommendation is to refresh the map again after a couple of minutes. Sometimes it may take longer for our map server to provide a map that has not been requested for a long time because it is no longer in the server's cache. If you continue to experience problems that you do not believe are related to the previously listed items, please contact us at ode@wunder.wustl.edu. Please include as much detail as possible about your Internet connection, machine, and the maps you are attempting to load.